
Your subscriber count says how many people pressed Subscribe once. Watch time from subscribers says how many of them still watch, and the retention segments show whether a video works for people who have never seen you before.
Every path and definition below comes from YouTube Help and YouTube’s own announcements, read on November 18, 2026, with each page linked where it is used.
Where do you find watch time from subscribers in YouTube Studio?
On the Audience tab. In YouTube Studio on a computer, click Insights in the left menu, then Audience, and find the card called Watch time from subscribers. YouTube Help says it shows “what percent of your watch time comes from subscribers and viewers who aren’t subscribed” (Understand your YouTube audience). Every single video has the same tab.
- For the whole channel. Open Studio, click Insights, then the Audience tab, and scroll to Watch time from subscribers.
- For one video. Click Content, point to the video, click Insights, then open that video’s Audience tab.
- Set the date range. Use the date picker at the top. A video’s launch week and its last 28 days often tell two different stories.
Studio’s Analytics page has been called Insights on desktop since November 13, 2026, when YouTube added plain-language summaries on top of the charts. YouTube’s announcement says the existing data and tools “are still fully available in Studio”.
What is a good percentage of watch time from subscribers?
There is no target number, and YouTube does not publish one. The share depends on what the video is for: a how-to answer pulls in strangers, a series episode pulls in fans. What YouTube does say is that “subscribers have been shown to watch twice as much video as non-subscribers” (New, casual, & regular viewers tips), so their share of watch time runs ahead of their share of viewers.
| What the card shows | What it usually means | What to do next |
|---|---|---|
| Most watch time from subscribers, on a new upload | The video reached the people who already know you, and few beyond them | Package it for strangers and put it in front of new viewers |
| Most watch time from non-subscribers, on a search or how-to video | Strangers found an answer; YouTube notes how-to viewers “may not necessarily return after they get their answer” | Add an end screen to a related video and give a reason to subscribe |
| A low subscriber share across the channel, with a large subscriber count | Many subscribers stopped watching; YouTube calls monthly audience “a more accurate way to estimate the size of your active audience” | Judge your reach by monthly audience, not by the subscriber count |
| A subscriber share rising month over month | Viewers are coming back and subscribing | Keep the topic and format that brought them |
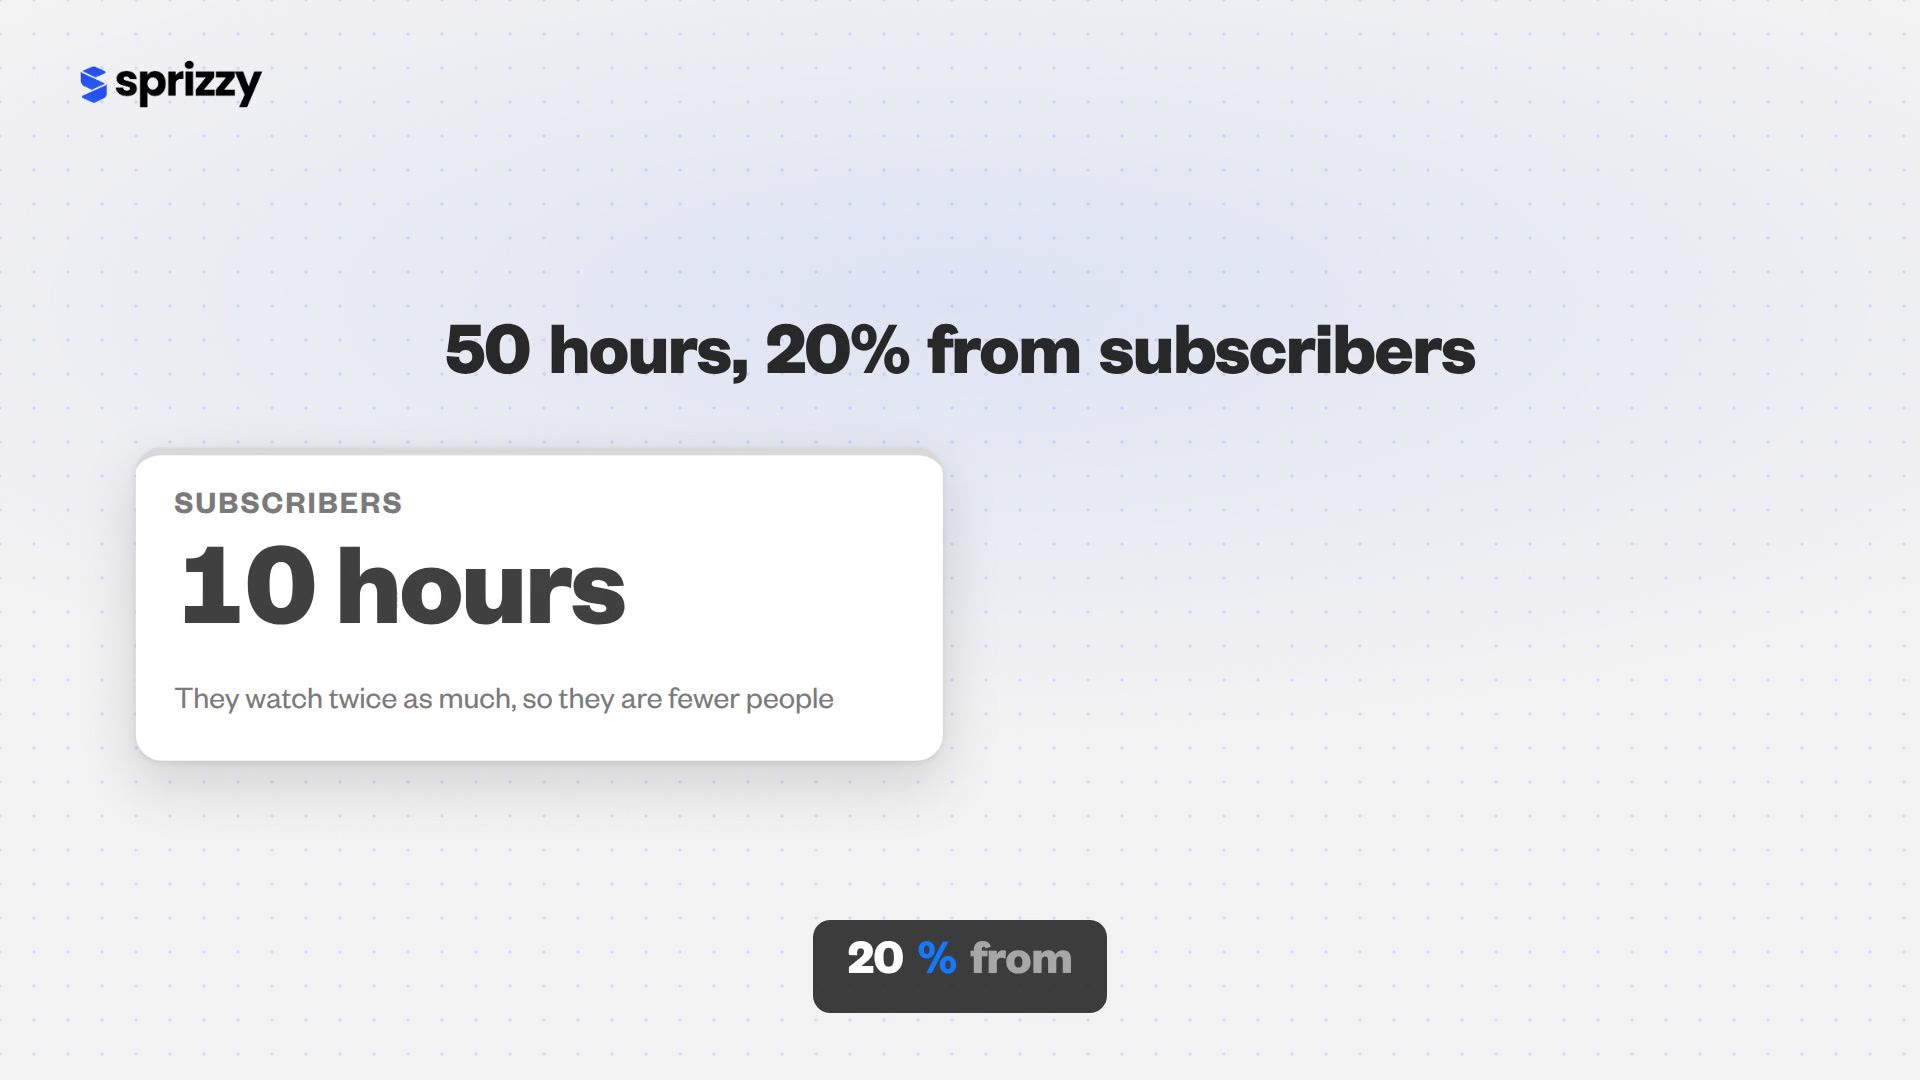
A worked example. Say a video earned 50 hours of watch time and the card reads 20% from subscribers. That is 10 hours from subscribers and 40 from people who have not subscribed yet: four of every five minutes watched went to potential new subscribers.
YouTube says its audience segments “do not affect reach or monetization” (YouTube Help). The split is a map of who watches, not a score.
How do you compare subscribers and non-subscribers on one video?
Use the Segments drop-down on the audience retention chart. Open the video’s Insights, go to the Overview or Engagement tab, find Audience retention and pick a segment. YouTube Help says the report lets you “compare new viewers vs returning viewers, subscribers vs non-subscribers” (Measure key moments for audience retention). Click See more to open the full comparison.
- Where the lines split. A gap that opens in the first 30 seconds points at the intro. YouTube’s Intro figure is the share that “still watched your video after the first 30 seconds.”
- Where only one line dips. A dip in the non-subscriber line alone usually marks an in-joke, a callback or a name a stranger does not know.
- Where both lines stay flat. YouTube says a flat line means “viewers are watching that part of your video from start to finish.” That stretch works for everyone.
Why the split matters. YouTube’s recommendation system judges a video separately for each group. YouTube’s senior director of growth and discovery, in a September 2026 interview on YouTube’s own channel:
“It’s learning for different audiences. So, it can learn that for subscribers, this video is not performing well. And for people who haven’t watched the channel, it is.”
Reading one real shape. Say a ten-minute video shows subscribers at 70% after 30 seconds and non-subscribers at 40%. The fans already knew the premise; the strangers needed it said. Write the next video’s first 30 seconds for the stranger.
Retention data “typically takes 1–2 days to process”, and key moments appear only on videos at least 60 seconds long with at least 100 views. Read a new upload on day three, not hour three.

How do you see organic vs paid viewers on the same video?
Pick Organic traffic or Paid traffic in the same Segments drop-down. YouTube Help says that “if you serve ads”, the report breaks viewers down by organic and paid. Organic views are “the direct result of user intention”, such as a search or a suggested video, and paid views are those “that result from paid placement”. Paid traffic then splits by ad type.
| Segment | YouTube’s definition | Where the viewer met your video |
|---|---|---|
| Organic traffic | views that are “the direct result of user intention” | search, suggested videos, browsing your channel |
| Skippable video ad | ads “auto-played before a video” that viewers “can skip after five seconds” | before another video, as an in-stream ad |
| Display ads | a viewer “clicking a display ad, including ads shown in search results or on other video watch pages” | in search results and next to other videos, as an in-feed ad they chose to click |
The format shapes the line. An in-feed viewer clicked your thumbnail, so that line starts warm. An in-stream viewer meets your opening seconds first, so those seconds do the choosing. In-feed vs in-stream ads covers what each format earns a channel.
This is where a Sprizzy promotion shows up. Sprizzy runs your video as an ad through Google Ads, YouTube’s official ad platform, and picks the mix of feed, in-stream and Shorts placements. Studio files those viewers under Paid traffic and the “YouTube advertising” traffic source.
In Studio, a view from a skippable ad longer than 10 seconds counts once the viewer has watched 30 seconds, or to the end if the ad is shorter (YouTube Help).
How should the paid line compare with the organic line?
Hold the paid line up against your non-subscribers, not your subscribers. Organic traffic carries your subscribers, people who already chose you. An ad’s job is to reach people who have not found you yet, so its fair match is the non-subscriber line. When the two track each other, the ad found the right strangers, and the video is ready for more of them.
| What you see | What it tells you | What to change |
|---|---|---|
| The paid line tracks the non-subscriber line | The audience is right and the video holds newcomers | Put more budget behind this video |
| The paid line drops at one moment the others pass | That moment needs context a newcomer lacks | Fix that moment in the next upload and keep the audience |
| The paid line falls faster from the first seconds | The opening is not doing its job for strangers | Rework the first five seconds and tighten the audience to closer topics and channels |
| The paid line holds better than organic | The ad audience is an even closer match than your usual traffic | Scale it, and make the next video for that audience |
Sprizzy does the tightening for you. It tests more than 200 combinations of keywords, channels and demographics, removes low-performing audiences and placements every hour, and moves your budget to the combinations that earn subscribers at the lowest cost. Sprizzy promotions start at $50.
YouTube built its upcoming video A/B tests around this chart: each edit gets its own retention curve. Its VP of Creator Product, on the YouTube blog on November 16, 2026, called retention curves “the true insight from the A/B testing.”
How do you filter any report by subscription status?
In Advanced Mode. From Insights, click Advanced Mode or See more under any report, then open Filter. YouTube lists filters for “geography, subscription status, and more” (Advanced Mode for analytics reports). Pair that filter with a traffic source breakdown and you see exactly how non-subscribers found a video, source by source.
- Open the video. In Advanced Mode, click the channel name at the top left and pick the video.
- Break it down by source. Choose Traffic source under Breakdown.
- Filter to non-subscribers. Add the subscription status filter and pick Not subscribed.
- Swap the filter. Switch to Subscribed and compare which sources feed each group.
Filter grayed out? YouTube says a filter “may be crossed out if it’s not compatible with the current view or if your video doesn’t have enough traffic.” It suggests a date range of more than 30 days when data is limited (YouTube Help).
To see where people clicked Subscribe, switch the breakdown to Subscription source. Subscribers who came from an ad sit on the “YouTube advertising” row (YouTube Help).
What should you change after reading the split?
Change the part of the video the weaker group left. If non-subscribers drop early, the title, thumbnail and first 30 seconds were written for fans. If subscribers drop, the topic strayed from what they subscribed for. If both hold and the subscriber share is high, the video works and simply has not reached enough strangers yet.
- Strangers leave early. State the premise in the first sentence and cut inside references. YouTube’s own advice is to “modify the first 30 seconds” and make the thumbnail and title “better reflect your video content.”
- Fans leave mid-video. Go back to the topics they came for. YouTube points to the Audience tab’s “Popular with different audiences” card for planning videos for each group.
- Everyone stays, few strangers arrive. The video is good and reach is the missing piece. Put it in front of people who watch channels like yours.
That last case is what Sprizzy is for: you pick the video and who should see it, by keywords, similar channels, location, age and gender. It runs on YouTube’s own ad platform, real viewers only, from $50, with a money-back guarantee on your first promotion.
The promotion will not cost you organic reach. YouTube ads do not hurt a channel’s organic growth, and every paid view is checked for a real person before it counts.
Common questions
Why is my watch time from subscribers so low?
Because most viewers of most videos are not subscribed, especially on search and how-to videos. YouTube's senior director of growth and discovery has said that on many channels "the majority of their audience can be non-subscribers." A low share means strangers are finding you. Check the subscriber line in the retention Segments menu to see whether your fans still watch to the end.
Does low watch time from subscribers hurt my channel?
No. YouTube says its audience segments "do not affect reach or monetization", and public watch time counts the same whoever it comes from. Recommendations are learned per audience, so a video can do well with non-subscribers while some fans skip it. A low subscriber share on a growing channel usually means new viewers are arriving faster than they subscribe.
Why don't I see Organic and Paid traffic in the Segments menu?
The organic and paid split appears when a video has been served as an ad, and YouTube notes that you "might need to enable Advanced Mode to access certain data." Retention also takes time: it "typically takes 1–2 days to process." Open the video's Insights, click See more on the retention chart, and pick a date range that includes the days the ad ran.
Where did YouTube Analytics go?
On desktop it is now called Insights. YouTube announced the change on November 13, 2026, adding plain-language summaries of how your channel and latest uploads are doing, and said the existing data and Analytics tools "are still fully available in Studio." Click Insights in Studio's left menu; the Audience tab, the retention chart and Advanced Mode are all there. The Trends tab is now called Research.
What is the difference between returning viewers and subscribers?
A returning viewer has watched your channel before and came back; a subscriber pressed Subscribe. They overlap, but they are not the same people. YouTube points out that subscribers "may not return for every new upload" of every channel they follow, and plenty of returning viewers never subscribe. That is why the retention Segments menu offers both splits.
Where do subscribers from a promotion show up in YouTube Studio?
In the Subscription source report, on the row YouTube describes as "YouTube advertising: Subscriptions from ads." From Insights, click See more on any card and choose Subscription source. In Sprizzy's report, the Campaign Subscribers column fills in once your channel is linked to Google Ads. Those viewers are real people who chose to subscribe, and they get your new uploads like any other subscriber.